License plate detection (LPD) is a famous application of digital image processing and machine learning in intelligent transport systems (ITS). In other words, many services of ITS depend on LPD. We call the act of finding and reading license plate (LP) numbers from a digital image as license plate recognition, I notice that it is different from license plate recognition (LPR). Here, by the word "detection" we mean localization and by the word "recognition" we mean localization + reading. So, LPR softwares consist two main steps:
- License plate detection (LPD)
- optical character recognition (OCR)
In LPD step, we should find bounding box of LP(s). In other words, we should find location of each license plate and determine a rectangle box surrounding it. After that we should read numbers and characters of it using OCR. LPD is assumed as main step of LPR systems because other step(s) depend on it and there is a lot research in OCR.
In this article we use opencv library to implement a simple license plate detection approach (we do not use implement ocr). For LPD step we try to find LP by its appearance and geometrical features.
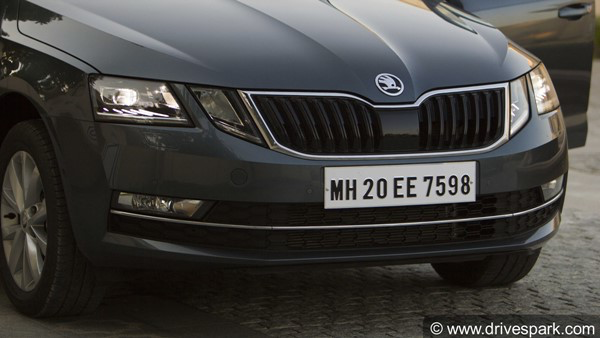 |
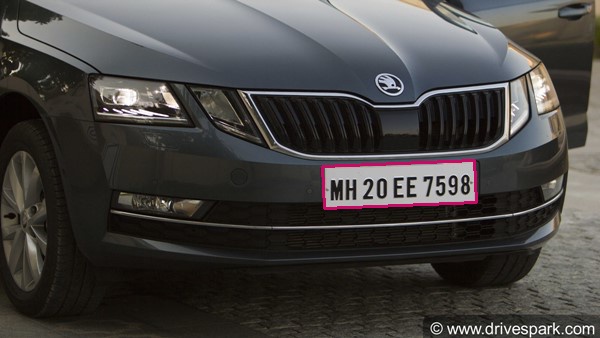
Fig, 1 depicts a sample of input image. As it can be seen license plate is a rectangular shape. Contour detection is a common way to detect a region and then analise . Many of variants of aforementioned ways accept binary image input. Due to high contrast between LP segments and other segments strong edges (color or gray level jumps) has been created in border of LP. So a edge detector can detect and separate LP region. We use Canny edge detector because it can repair deleted edges caused by noises. So for LPD following steps must be done:
- Reading input image
- Converting input image to gray level
- Applying Canny edge detection
- Applying contour detection
- geometrical Analysis
Before any thing we should import necessary libraries:
import cv2
import numpy as np
import random as rnd
cv2 has been used for opencv methods. numpy is a calculation library and random has been used for creating random numbers.
1. Reading input image
for reading input image you must call imread method:
im = cv2.imread('D:/dataset/andrewmvd/images/cars111.png', cv2.IMREAD_UNCHANGED)
here, we read input from the path as image unchanged. you can use cv2.IMREAD_GRAYSCALE flag instead of cv2.IMREAD_UNCHANGED in order to read the image as grayscale. if you use unchanged flag, you should convert it grayscale using cv2.cvtColor method. Since I want to use main image for showing final result, I should use the conversion.
1. Reading input image
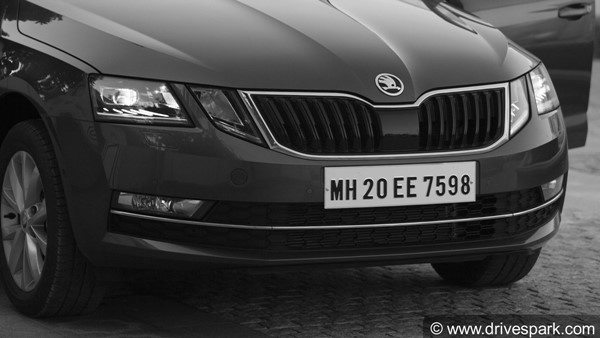
As we mentioned before we must convert our image to grayscale.
gray = cv2.cvtColor(im, cv2.COLOR_BGR2GRAY)
 |
Applying Canny edge detection
After reading an image you can apply Canny edge detection.
edge = cv2.Canny(gray, 200, 200)
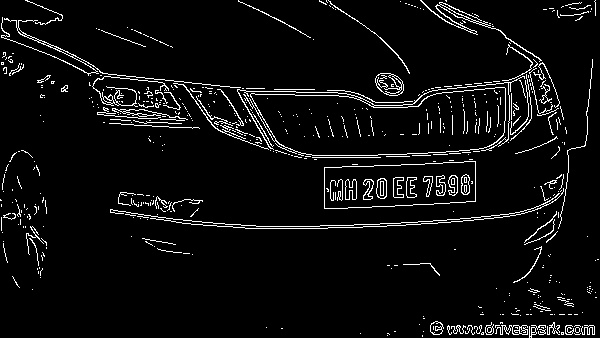 |
| Fig, 3) result of Canny edge detection on Fig. 2 |
Canny edge detector requires two main hyper parameters including threshold1 and threshold2. The first one is sensitivity of thresholding and second one is strongness of linking (or repairing) edges. You should choose them by test and try.
Applying contour detection
By applying contour detection, we can find all components of Fig, 3. In order to show found bounding box (or rotated rects) of contours, we use a piece of code which is not necessary in a real scenario.
# Find contours
contours, _ = cv2.findContours(edge, cv2.RETR_TREE, cv2.CHAIN_APPROX_SIMPLE)

# Draw contours
drawing = np.zeros((edge.shape[0], edge.shape[1], 3), dtype=np.uint8)
for i in range(len(contours)):
    color = (rnd.randint(0, 256), rnd.randint(0, 256), rnd.randint(0, 256))
    rect = cv2.minAreaRect(contours[i])
    box = np.int0(cv2.boxPoints(rect))
    cv2.drawContours(drawing, [box], 0, color, 2, cv2.LINE_8)

cv2.imshow('a', drawing)
cv2.waitKey()
findContours method will find contours or connected components of edge image shown in Fig, 3. Remaining part of the codes draws contours in the edge image that you can remove them.
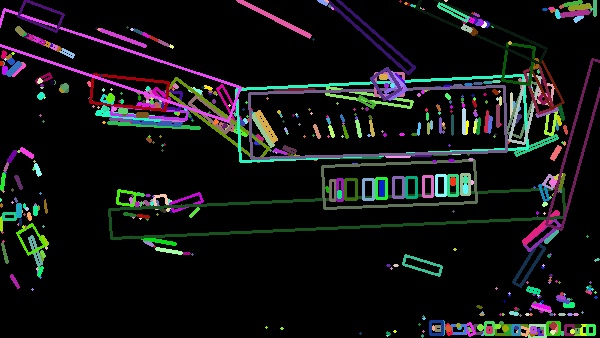 |
| Fig, 4) min area rect of detected contours |
As it can be seen in Fig, 4, there are lot of contours. I should notice that color of each contour is generated randomly, so it will be different in your computer. Now, we should choose correct contour by filtering them using its geometrical properties (or other properties!). As you can see, LP contour is a horizontal rectangular shape.
def filter_contours(cnts,
                    min_w, max_w,
                    min_h, max_h,
                    min_whr, max_whr):
    res = []

    for i in range(len(cnts)):
        rect = cv2.minAreaRect(contours[i])
        (cx, cy), (w, h), a = rect
        whr = w/h
        if(w > max_w or w < min_w or
            h > max_h or h < min_h or
            whr > max_whr or whr < min_whr):
            continue

        res.append(rect)

    return res
here we define filter_contours method to filter unwanted contours. As it can be first we find rect using minAreaRect method. whr is weight to height ratio. Then each found properties of each rect is compared to min_w, max_w, min_h, max_h, min_whr, and max_whr. if they are not within in a predefined range they will be rejected, else they will be added to to res as result.
# Find contours
contours, _ = cv2.findContours(edge, cv2.RETR_TREE, cv2.CHAIN_APPROX_SIMPLE)

# Filtering contours
contours = filter_contours(contours, 150, 200, 40, 60, 3, 5)

# Draw contours
drawing = np.zeros((edge.shape[0], edge.shape[1], 3), dtype=np.uint8)
color = (100, 10, 200)

for i in range(len(contours)):
    rect = contours[i]
    box = np.int0(cv2.boxPoints(rect))
    cv2.drawContours(im, [box], 0, color, 2, cv2.LINE_8)

cv2.imshow('a', im)
cv2.waitKey()
By filtering contours, all unwanted will be removed.
 |
| Fig, 5) result of the LPD procedure |
Result of the LPD procedure has been illustrated in Fig, 5.